log
This document is a guide on how to view and configure DS for Mobile logs based on the log screen of the Security 365 Management Center.
1. Log Overview
All major actions occurring in DS for Mobile areSecurity 365 Management Center (Portal) Log MenuYou can check it at.
Log items
- User App Usage History
- Administrator Policy Setting History
- Allow / Block History by Conditional Policy
- System and Security Event Tracking
log isUser LogWowAdmin LogIt is separated by logs, and can all be viewed on the same log screen.
2. Log Access Path
- Path:Security 365 Management Center > Logs
- User Log
- Admin Log
When you select the log type from the left menu, the corresponding log list screen will be displayed.
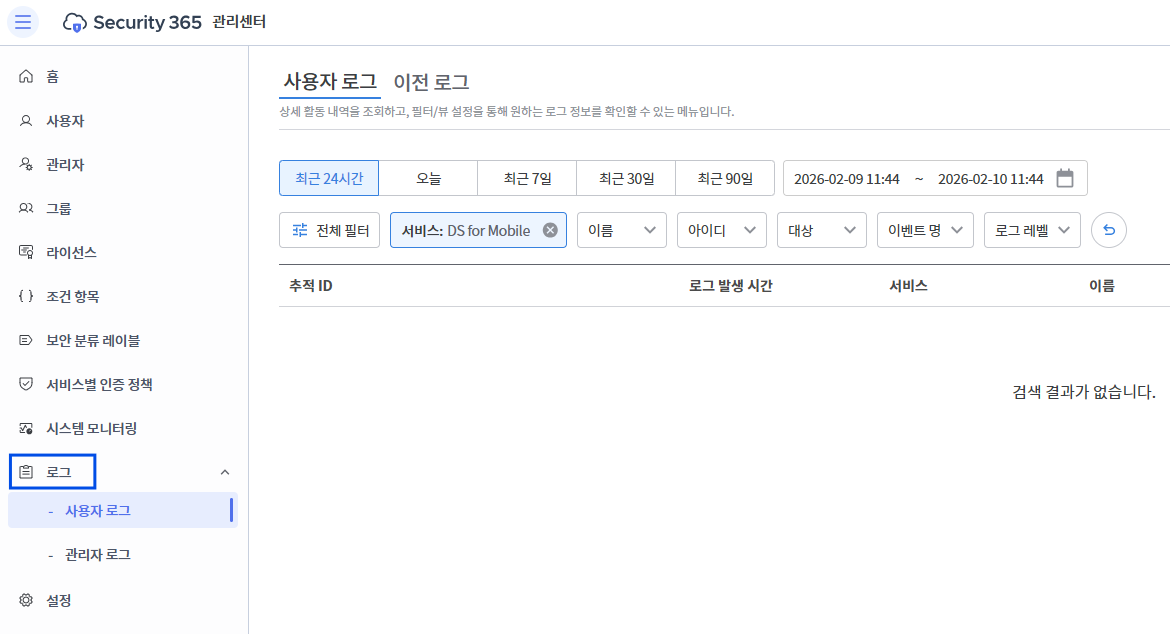
3. Log Query Screen Configuration
3.1 Period Selection
Logs can be queried based on the desired period.
Quick Selection
- Recent 24 hours
- today
- Recent 7 days
- Last 30 days
- Recent 90 days
Direct Specification
-
Select start date/time ~ end date/time directly
-
Utilization for log tracing at a specific point in time
3.2 Log Filter Options
At the top of the log list, you can use various filter options to finely narrow down the target for viewing.
Basic Filter Items
| item | Description |
|---|---|
| All Filters | Integrated filter for setting all filters at once |
| Service | Select the service to view logs |
| name | Enter user or administrator name |
| id | Enter user or administrator account ID |
| Target | Log Generation Target Object |
| Event Name | Types of Events That Occurred |
| Log Level | Log Severity Level Filter |
3.3 Service Filter
- Filter that allows viewing logs of a specific service
- Selectable services example:
- Security 365
- SHIELD DRM
- SHIELD Drive
- SHIELD Mail
- DS for Mobile
- Document Security etc.
| All Filters | Service Filter |
|---|---|
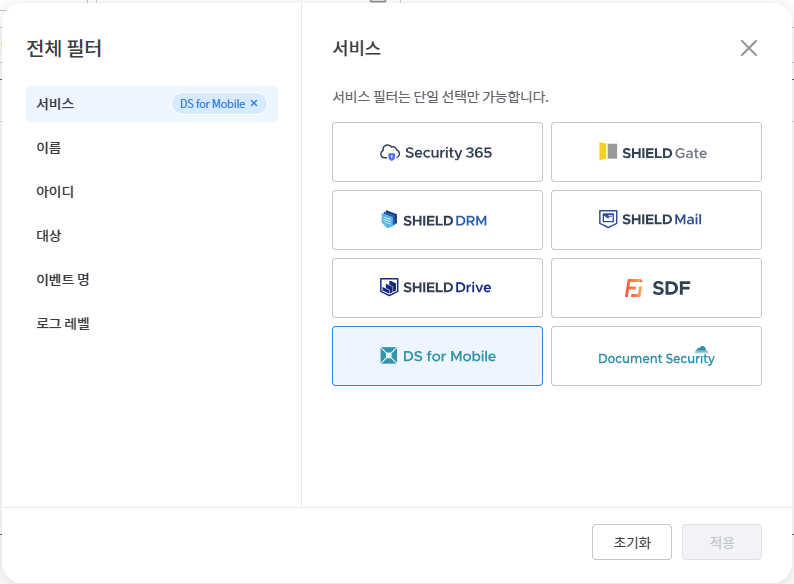 | 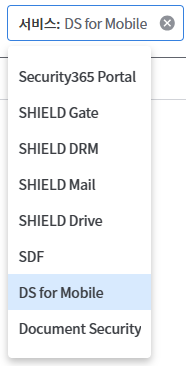 |
To check the DS for Mobile logs
**Select "DS for Mobile" in the service filter.**must do.
3.4 Name / ID / Target / Event Name
-
Name / ID / Target / Event NameThe filter retrieves data by directly entering a string.
-
Logs are filtered based on the input value.
-
**The event name filter is activated only when a service is selected.**It is possible.
3.5 Log Level Filter
You can classify and query logs according to the log level.
| Log Level | Description |
|---|---|
| ERROR | System error, processing failure |
| WARN | Blocking and restrictions by policy |
| INFO | Main Events Processed Successfully |
| DEBUG | Debugging Purpose Log |
| TRACE | Detailed Tracking Log |
In the production environment, it mainlyINFO / WARN / ERRORUse logs.
3.6 All Filters
-
When selecting the entire filter, a modal window will be displayed.
-
The following items can be configured on one screen:
- Service
- name
- id
- Target
- Event Name
- Log Level
-
It is useful to query logs at once by combining multiple conditions.
4. Log List and Detail View
4.1 Log List
The log list displays the following information.
- Log occurrence time
- Service
- name
- id
- Target
- Event Name
- Log Level
4.2 Log Details
When you click on a log item, on the right sideSlide-type detailed information panelThis will be displayed.
Detailed Information Structure
User Information
- name
- id
- Department
- IP address
Log Information
- Occurrence Time
- Event Name
- Event Code
- Log Level
- Target
Log content
- Detailed log message
This allows you to trace the causes and effects of specific events.
5. Additional Function Description
5.1 Log Download
- Download log file based on the currently retrieved conditions
- Can be used for audit and history management purposes.
5.2 Search
- Automatically re-query logs when filter conditions change
- Used for tracking specific users and events
5.3 Refresh
- Re-query the latest logs
- Used for real-time monitoring
5.4 Specify Number of Pages in List
-
Select the number of logs to display on a page
-
For example: 15 items / 30 items / 50 items, etc.
-
Improving readability by adjusting the number of pages when there is a large amount of log data.
6. Organizing DS for Mobile Log Items
6.1 User Log
| Event Name | Event Code | Description | Log Level |
|---|---|---|---|
| Login | USER_LOGIN | User successfully logs into the app | INFO |
| File Open (View) | DOC_READ | Normal document viewing | INFO |
| File Open Block | DOC_READ | Access blocked due to conditional policies, etc. | WARN |
| File Sharing | DOC_MIP_CONVERT | Download the document and share it with external apps. | INFO |
6.2 Administrator Log
| Event Name | Event Code | Description | Log Level |
|---|---|---|---|
| Conditional Policy Registration | CONDITIONAL_POLICY_CREATE | New Registration of Conditional Policy | INFO |
| Conditional Policy Modification | CONDITIONAL_POLICY_UPDATE | Change of Conditional Policy Settings | INFO |
| Delete Conditional Policy | CONDITIONAL_POLICY_DELETE | Delete Conditional Policy | INFO |
| Conditional Policy Copy | CONDITIONAL_POLICY_COPY | Conditional Policy Copy | INFO |
| Conditional Policy Download | CONDITIONAL_POLICY_DOWNLOAD | Download Policy Settings (JSON) | INFO |
| Change in Policy Priorities | CONDITIONAL_POLICY_PRIORITY_CHANGE | Change in Policy Application Order | INFO |
7. Summary of Log Level Criteria
- INFO
Normal processing of user/admin actions - WARN
Blocking due to conditional policies or security policies - ERROR
System error, authentication failure, processing failure
Blocking by conditional policy is
**This is an intended security action, so it is logged as a WARN.**It is possible.