Dashboard Guide
1. Overview
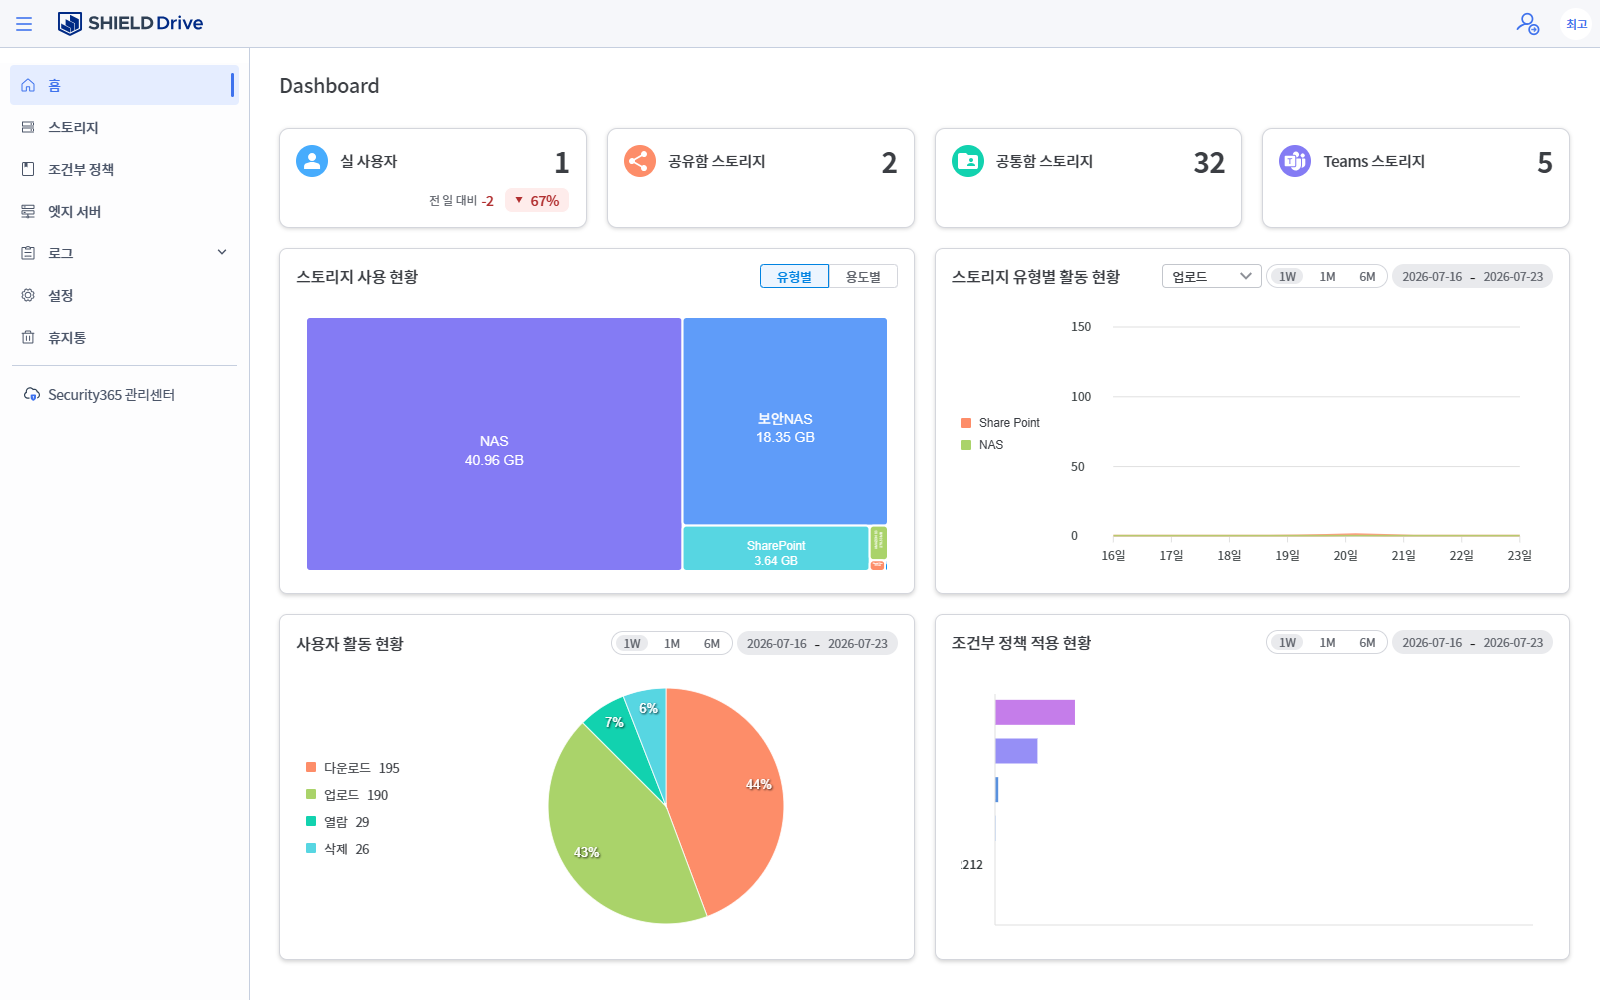
The dashboard is the administrator home screen that allows you to understand the system status and usage of SHIELD Drive at a glance. It is displayed by default when accessing the admin page and provides metrics and charts for the number of active users, number of storages, storage usage, user activities, and the status of conditional policy applications.
2. Top Summary Indicators
Four summary cards are displayed at the top of the screen.
| indicator | Explanation |
|---|---|
| real user | The number of users who actually executed the event. The increase/decrease amount and percentage compared to the previous day are displayed together. |
| Shared Storage | Number of registered shared storage boxes |
| Common Function Storage | Number of registered common storage units |
| Teams Storage | Number of registered Teams integrated storages |
If the number of users on the previous day is 0, the actual user growth rate will be displayed as N/A.
3. Storage Usage Status
Displays the usage capacity of the entire storage as a treemap. You can switch the aggregation criteria with the top toggle.
- By Type: NAS, Security NAS, SharePoint, Google Drive, etc. based on storage type
- By Purpose: Personal Box, Shared Box, Common Box, Teams Box, etc. based on purpose
4. Activity Status by Storage Type
Displays the activity volume by storage type over time for the selected event type.
- Select the event type (upload, download, etc.) to view.
- Query unit: 1 week (1W) / 1 month (1M) / 6 months (6M), or set the period directly
- Storage types with no uploaded records will be excluded from the graph.
5. User Activity Status
Displays the ratio of events executed by the user by type (donut chart).
- Aggregate Events: Download, Upload, View, Delete, etc.
- The query unit and period settings are the same as in Chapter 4.
6. Status of Conditional Policy Application
Displays the number of times the triggers (applications) of registered conditional policies are shown in a bar chart.
- The top 6 will be displayed in order of the number of applications.
- The query unit and period settings are the same as in Chapter 4.
7. Query Period and Exception Handling
The query period can be set for up to 6 months.
| situation | Display message |
|---|---|
| Query period exceeded (maximum 6 months) | Cannot retrieve data beyond the data retention period. |
| No data | No data exists. |
| Network error | Failed to load data. Please contact the administrator. (+ error code) |
| Failed to load some data | Failed to load data. Please contact the administrator. (+ error code) |