Dashboard Guide
※ Last updated: 2025-09-08
SHIELD Mail dashboard is a screen that allows real-time monitoring of email sending and receiving status, attachment processing and error status, and license usage status.
You can access the dashboard menu from the admin page, which provides an intuitive overview of the system operation status.
1. Dashboard Configuration
SHIELD Mail Admin Page
홈Click the menu to access the dashboard screen.
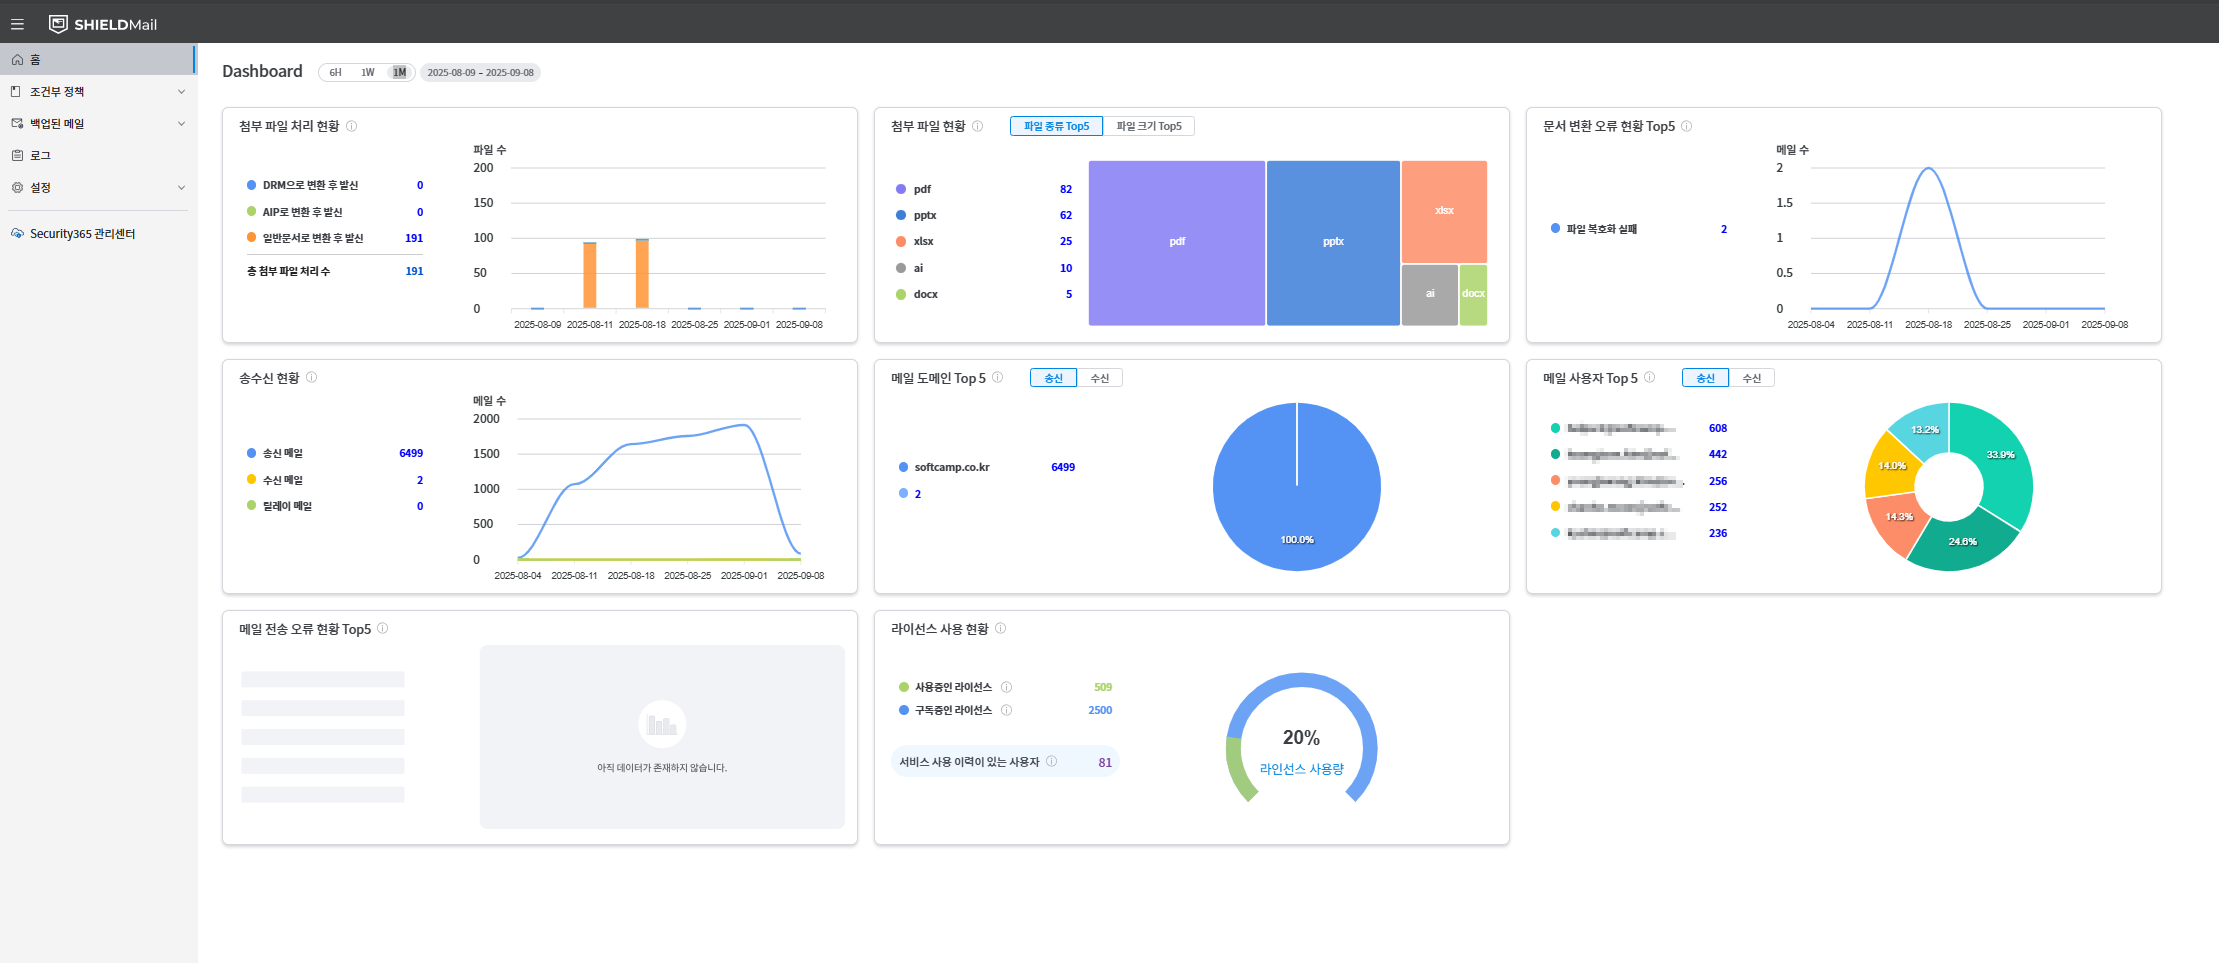
- The dashboard screen consists of cards and charts as shown below:
- Attachment File Processing Status
- Attachment Status (Type/Size Top5)
- Document Conversion Error Status Top 5
- Transmission and Reception Status
- Top 5 Mail Domains (Sending/Receiving)
- Top 5 Mail Users (Sent/Received)
- Mail Sending Error Status Top 5
- License Usage Status
2. Dashboard Card Information
2-1. Attachment File Processing Status
- Monitor the conversion, decryption, removal, and sender blocking status of email attachments in real-time.
- Processing items:
- Send after conversion to DRM
- Send after conversion to AIP
- Convert to a regular document and send.
2-2. Attachment Status
- attached file'sby type / Size RangeVisualizing the number of cases based on the Top 5 criteria.
2-3. Document Conversion Error Status Top5
- Displays the types and counts of errors that occurred during the document conversion process based on the Top 5 criteria.
- Example item:
- File conversion failed
- File encryption failed
2-4. Transmission and Reception Status
- This card visualizes and displays the number of email sent and received, as well as the number of relay emails, by time zone.
- Each data is updated in real-time, and the number of sent, received, and relay emails is distinguished by different colors on the graph.
- **Sent mail (blue):**Number of sent emails
- **Received email (yellow):**Number of received emails
- **Relay Mail (Green):**Relay mail count
- The graph shows the number of emails by time period, making it easy to identify the email traffic patterns for specific time periods.
2-5. Mail Domain Top 5
- Displays the top 5 domains most used for sending/receiving.
- You can switch between the Send/Receive tabs to view each one.
2-6. Mail Users Top5
- Displays the top 5 by mail sender/recipient.
- You can switch between the Send/Receive tabs to view each one.
2-7. Email Sending Error Status Top5
- Displays the types and counts of errors that occurred during the email transmission process based on the Top 5 criteria.
- Example item:
- EML transmission error
- Mail server related errors
- Recipient-related error
2-8. License Usage Status
- Visualizes the actual usage compared to the licenses allocated to the system.
- User-based/subscription license status will also be displayed.
- Example: License usage rate 50%
3. Notes
- Data can be filtered by 6 hours, 1 day, and 1 week, and data for each period can be compared graphically.
- Each dashboard card navigates to a detailed page upon clicking, allowing you to view more detailed statistics and history.
Internal document link
It is scheduled for an update.